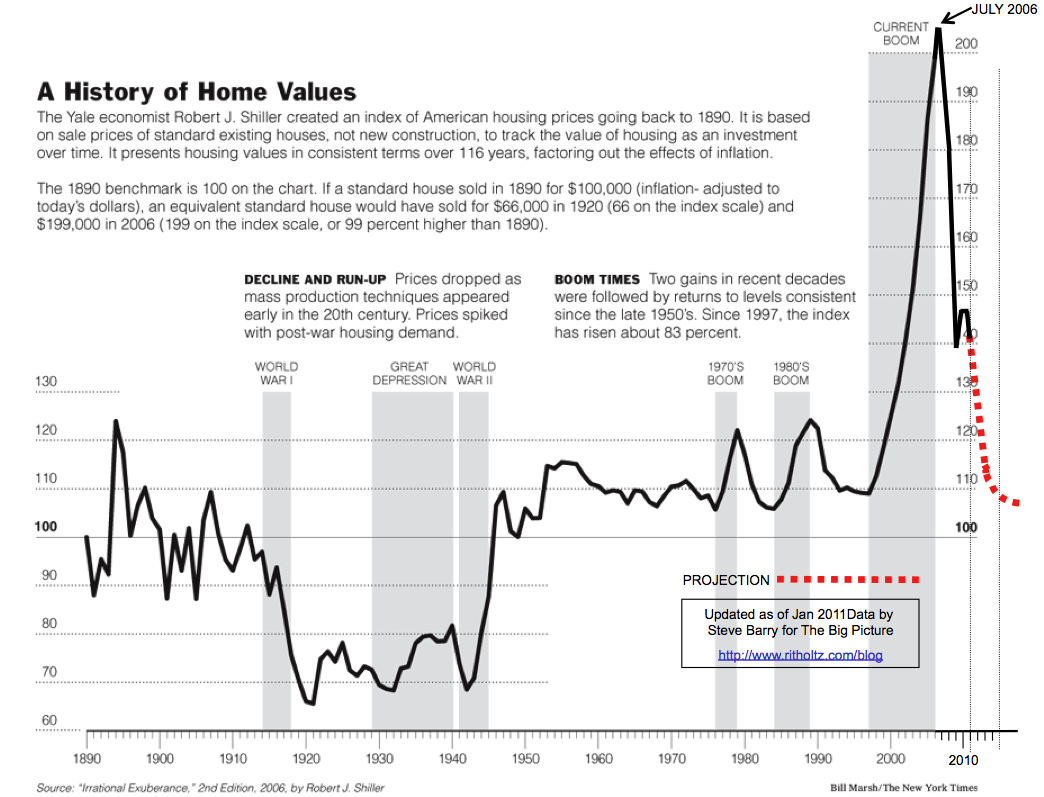
Real Estate Stats – charts, graphs, news and real estate statistics from top real estate experts.
Statistics to help Realtors
Realtor.org July 2011 Stats
Find out how many active real estate licensees reside in your state here.
Above graph from:
http://www.ritholtz.com/blog/wp-content/uploads/2011/04/2011-Case-SHiller-updated.png
.
See How Many Homes Were Sold in Your State
Housing Affordability Index
NATIONAL ASSOCIATION OF REALTORS® Housing Affordability Index
| Affordability Median Priced Monthly Payment Median Indexes Existing Single- Mortgage P&I as a% Family Qualifying
| |||||||||||||||||||||||||||||||||||||||||||||||||||||||||||||||||||||||||||||||||||||||||||||||||||||||||||||||||||||||||||||||||||||||||||||||||||||||||||||||||||||||||||||||||||||||||||||||||||||||||||||||||||||||||||||||||||||||||||||||||||
•Adjustable mortgage rates arenot available since 2010.
••Based on a 25% qualifying ratio for monthly housing expense to gross monthly income with a 20% down payment.
•••Effective rate on loans closed on existing homes-Federal Housing Finance Board.
p Preliminary r Revised
©2011 NATIONAL ASSOCIATION OF REALTORS
Transactions Down from Prior Year; Price Stronger than ExpectedREAL Trends Interpretation of June 2011 Existing Homes Sales
data from the National Association of REALTORS® public release
Forecast
Thank you for visiting our real estate stats page.
We hope Realtors will find these stats helpful and we thank the experts that provided them.
COACHING | TRAINING | REALTORS® | BE A PRO
“Be a Pro” in your real estate business without spending a fortune. The Top Producer Group, LLC offers affordable real estate coaching membership options, giving EVERY agent access to personalized one on one coaching and training. Our Integrity Rule ensures everything we share has been tested and proven to work by current top producers. For more details about Top Pro Training and Be A Pro Coaching call (910) 681-1110.
Top Pro Real Estate Training and Be A Pro Real Estate Coaching Programs

